import numpy as np
import matplotlib.pyplot as plt
import matplotlib.colors as mclr
nt = 101 # length of the series
nc = nt-1
a = np.zeros(nt)
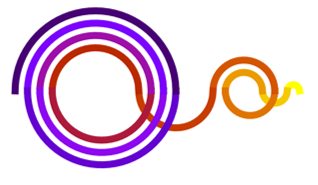
#////////// generate the Recaman series ////////////////
for j in range(1,nt):
an = a[j-1] - j
if (an > 0) and (not an in a): a[j] = an
else: a[j] = a[j-1] + j
#////////// grafics //////////////////////////////////
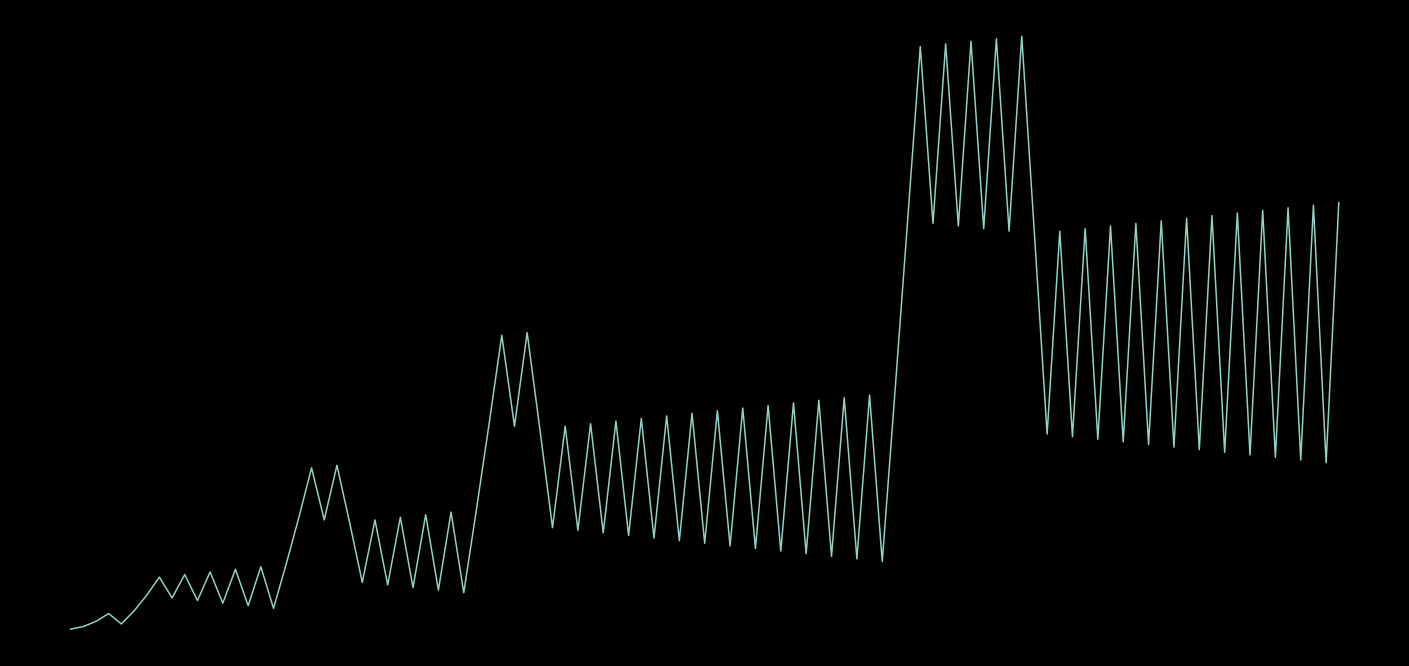
da = np.diff(a)
xc = a[0:-1] + 0.5*da # center of the circles
ng = 700 # resolution of the circles
xi = np.linspace(-1,1,ng)
def draw_circle(jn,ax,ay,r):
x = xi*r
y = np.sqrt(r**2 - x**2)*(-1)**jn
return ax+x, ay+y
with plt.style.context('fast'): # 'dark_background'
cmap = plt.cm.get_cmap('plasma')
cmap = plt.cm.get_cmap('hsv')
cmap = plt.cm.get_cmap('gnuplot')
#cmap = plt.cm.get_cmap('jet')
#cmap = plt.cm.get_cmap('gist_rainbow')
cmap = plt.cm.get_cmap('Blues')
cmap = plt.cm.get_cmap('brg')
fig, ax = plt.subplots(figsize=(25,12))
for jn in range(nc):
xg,yg = draw_circle(jn,xc[jn],0,abs(0.5*da[jn]))
color = cmap((nc-jn)/nc)
#color = np.array([47, 49, 147])/255.
plt.plot(xg,yg, lw=3, color=color,alpha=1)
plt.axis('equal');plt.axis('off');
#plt.savefig("Reca_circles_white_50.png")
plt.show()